For the last two months our in-depth article series on gambling trends has focused solely on gambling’s proliferation within various markets. We’ve analyzed global gambling growth, forecast future growth in Europe and assessed the potential for the rapid rise of online gambling in emerging markets like Asia and South America. Each of these articles has focused on place – in essence, where is online gambling strongest or likely to be strong soon?
In this, the fourth article in the series, we turn our attention to people. Who are the people betting online? Who prefers online slots and who prefers poker? And what is the age, gender and educational breakdown of gamblers across game types? Though some of the article will compare gamblers by country (i.e. place), the real focus is the people inside of those places.
AGE, GENDER & EDUCATION SEGMENTATION AMONG GAMBLERS
Fifty years ago many considered gambling a scourge on society, and excessive gambling was viewed as a medical condition. It was Robert Custer, an American psychiatrist studying gamblers and their behavior in the 1960’s and 1970’s, who first linked specific personality traits to a propensity for gambling and put forth the idea that gambling could be as addictive as drugs and alcohol. According to Custer, nearly all of the patients in his survey showed similar characteristics. On the one hand, they were clever, charismatic and generous. On the other, they were impulsive, anxious, restless, in search of immediate gratification and chronically depressed.
It’s unclear whether the public’s opinion of gambling has changed in the time since Custer published his findings. The widespread popularity of online gambling suggests it has. His findings, however, paved the way for future studies that would explore the mutable and immutable characteristics shared among gamblers.
As an example, the British government now estimates that 0.6% of its citizens are excessive gamblers, and has linked this status to a host of other traits, among them poor health, being single, separated or divorced, lacking employment and possessing, on average, less education than non-gamblers.
Similar 21st century studies of gambling focus on age, gender and education segmentation of those participating in betting games. In 2009, a study conducted by GP Bullhound found that a full 43% of online gamblers were women.
A 2010 study of U.S. online gamblers showed that those who prefer non-strategic games like roulette, slots and craps are typically older than those that prefer strategic games like poker and blackjack. The study also showed that non-strategic gamblers were less educated (60.4% with some college education compared to 79.6% for strategic gamblers), and more likely to be women (71.5% versus 30%).
Yet another study revealed that women typically play longer and at lower stakes, while men play frequently and bet more, but for shorter durations.
The applications for data collected in these kinds of studies isn’t only scientific. Online gaming operators use this information to orient their existing websites and develop new ones. The current explosion of online bingo communities and their anticipated growth attest to the fact that operators are paying attention to who bets, how much and for what reasons.
WHICH COUNTRIES SPEND THE MOST ON GAMBLING?

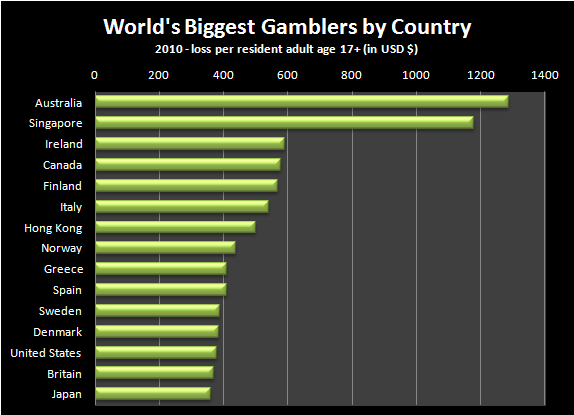
When it comes to the location of bettors – and here we arrive at the “where” part of this article – surveys suggest that citizens of some countries are more likely to bet than others. The below Chart A compares citizen’s average annual gambling expenditures across the world’s 15 highest betting countries. The results, which measured net spending in each country’s legal forms of betting divided by the number of residents aged 16 and up — were somewhat surprising.
Australia is the big winner (or loser, depending on your opinion of gambling). Macau and Monaco, both of whom one would expect to see here, don’t even make the cut. This is because both derive the bulk of their gambling revenue from tourists. Singapore nears the top of the list due to its recently opened and incredibly successful Marina Bay Sands and Resorts World Sentosa casinos. The earnings of these two casinos alone nearly outgross the entire Las Vegas Strip.
Industry watchers expect to see more Asian countries at the top of the list soon. Western-style hotel-casino complexes are being built in Vietnam and the Philippines and developers are tripping over themselves at the prospect of markets opening in India and Japan.
JAPAN VS. AUSTRALIA…AND SINGAPORE ON THE RISE
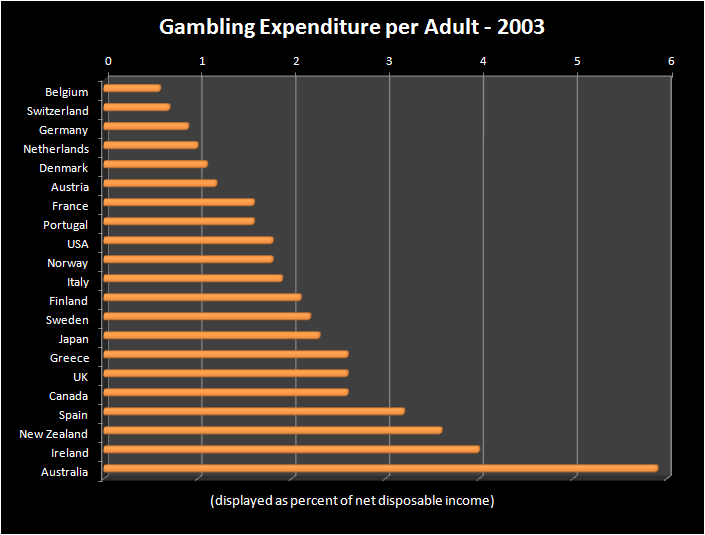
The below Chart B appears to tell a story similar to that of the above. In short, Australians and the Irish gamble a lot. There are, however, two big differences between the information presented in these graphs.

The first is that the above Chart A shows only average number of dollars lost per capita. The below Chart B takes this one step further by converting these dollars into a percentage of disposable income per capita. If you’re not sure why that’s important, you’re not alone. Below is a mathematical explanation for why a country like Japan is in the top 30th percentile on one list, and in last position on another.
Let’s start by looking at what we know about Joe Japan.
1) He lost USD $375.00 on gambling in a single year. (Chart A)
2) He spent 2.3 percent of his gross income in a single year. (Chart B)
If we divide the total spent ($375.00) by the percent of income spent (2.3%), we arrive at $163.04. This number represents 1% of Joe Japan’s total income. Add two zeros to the end of this number (i.e. multiply by 100) and we get the average total income ($16,304.00) for Japanese residents.
Doing the same for Australia, we arrive at an average Australian income of $22,069.00. Thus, we can see why Japan’s position in Chart A is so different from its position in Chart B. Assuming that the average rate of loss while gambling is consistent across markets, in relative terms Japanese residents both outspend and out-lose their Australian counterparts.
The second difference between the information presented in the charts is that Chart A shows information from 2003, while Chart B is from 2010. The decision to present information from 2003 was intentional. Here, Singapore does not even appear on the list. A short seven years later, it is in position number two in terms of average spending. Why? Because, as earlier mentioned, Singapore’s resort and casino culture is booming. Experts predict gambling expenditures within Asian countries will comprise more than twice that of all other markets within the next decade.
WORLD’S BIGGEST GAMBLER’S BY COUNTRY: SUMMARY
The above charts and information on age, gender and education segmentation among gamblers offer significant insight into the future of online gambling. Why one man or woman gambles and another doesn’t is another subject, as are gambling regulatory and legislative developments in individual European markets. Both will profoundly impact online gambling, and both will be the subject of future articles in our series on gambling trends.

